A Note About Win Expectancy Early on in the Race

If you haven’t read about it already, I’ve made a win expectancy tracker for IndyCar. Something interesting I came across while developing it…

Below is the win expectancy for the driver in first place at different stages of the race.

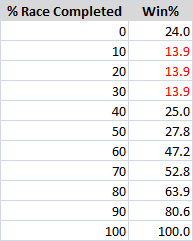
You’ll notice that the win expectancy actually drops off from the initial 24 percent during the 10-30 percent of the race completed stages. Why would the driver in first be less likely to win the race when 10 percent of the race is completed than when he started on pole (and thus had more of the race left to complete)?

First, I think that the beginning of the race is pretty chaotic and a lot of overtaking happens, so it’s pretty easy for the guy who started on pole to get overtaken.

And second (and more likely), if a driver started on pole and knows he has a competitive car, he may not be too worried about leading right away. He’ll let the aggressive guy in second place overtake him and then just focus on strategy, conserving fuel and tires, etc. Just preparing for the second half of the race where things start to matter more.

If you have any more ideas on it let me know in the comments.

by Drew

Tracking Live Win Expectancy

I’ve been working on a win expectancy tracker for IndyCar similar to the one FanGraphs uses for baseball. Based on the driver’s current position and how much of the race is completed, it calculates the percent chance he will win the race — using historical data from the 2013-2016 seasons.

It works by finding the win percentage of drivers who were in similar situations in the past. For example, if a driver is running in second place with 60 percent of the race completed, he has a 13.9 percent chance of winning the race. That’s based on five drivers in the database (36 races as of writing) being in second place with 60 percent of the race completed going on to win the race.

If a driver has a 23 percent chance of winning, that means 23 percent of drivers in the same situation went on to win the race.

Besides telling how likely each driver is to win the race, it’s also beneficial to see which drivers need to make big strategy moves to have a shot at winning. If a driver only has a 13 percent chance of winning, maybe he’ll want to go off strategy and hope to get lucky with a caution. Win expectancy is also interesting to look back at after the race to see when the big moments of the race were.

It’s important to note that win expectancy doesn’t care about who the drivers are, the prevalence of cautions at certain tracks, or anything else of that nature. So it’s a bit of an oversimplification, but a useful one nonetheless. It reports the long term averages for running position and the amount of the race completed.

Road/street course results are separate from oval results, but so far only the former is done.

I’ll be tweeting out live win probabilities during races and also including them on the site.

by Drew

Vote For the Greatest Driver of All Time (If You Have a Facebook and It’s One of These Five Drivers)

The Drive published an article today entitled “We Rank IndyCar’s Greatest Drivers of All Time.”

It’s really just a top five list of the drivers who have the most race wins, so I don’t really get it. But anyway, they have a poll setup on their Facebook page where fans can pick who they think the best driver of all time is: as long as it’s Unser, Foyt, Dixon, Michael or Mario Andretti.

You can go vote in that poll here.

Five hours in, here’s how the votes look:

Driver     % of vote
Foyt 69.7
Mar Andretti 23.1
Unser 5.4
Mic Andretti 1.8
Dixon 0

by Drew

Who’s On Pace for the Title?

Over the past five seasons, the championship winner has accumulated an average of 569 points. I’ll be tracking which drivers are on pace to hit that number by the end of the season. This will give us an indication of who is setting themselves up for a good shot at the championship and which drivers are falling behind. The real winner may have more or less than that this season, but the pace tracker will still be able to tell us how drivers are doing relative to the field. The pace is represented as a percentage of the target (31.6 points per race, adjusted for double points races). 

You can check out the latest pace update here. There will also be a widget in the sidebar (may not be visible on mobile) showing the top performers. 


-Drew

Championship Update After Phoenix

Dixon took home 53 points from Phoenix last race after leading 155 of the 250 laps. His win, which came under caution, put him in second place in the points — a five place improvement from where he was at before the race.

Pagenaud’s second place finish was good enough to get him to first place in the championship with a four point lead on Dixon. Montoya is nine points out from Pagenaud with 74 points.
Power gained some much needed points (35) after missing the first race, so don’t count him out of the championship just yet. The season’s still early and there are lots of points left to be earned. That being said, he can’t afford three DNF’s like he had last season going forward. Every race is going to be important.
Once a couple more races are completed and the standings are less susceptible to drastic change, I’ll be including a “one race change” value in these championship updates. 
Here’s how the rest of the field shakes out after round two:

-Drew