
All of the top finishers at this year’s Indy 500 stopped five times for fuel and tires throughout the 200 lap race. Most drivers came in around Lap 30-34 for their initial stop since the first caution didn’t come out until Lap 48 when Sato ran into the back of a slow moving Davison. Since this first stint was run completely under green, I wanted to use it to evaluate the tires at the race.
I chose to use the top three finishers of the race–Power, Carpenter, and Dixon–for my analysis for two reasons. First, since getting the data into the format I needed took a bit of leg-work, it’s simpler to limit the number of drivers I use. And second, since they performed the best on Sunday, I thought it would be interesting to see how the tires worked for them especially.
Both Power and Dixon ran 32 lap stints while Carpenter ran one lap less before pitting for the first time. Here is a graph of all three of their lap times for every lap of their first stint, not including the in-lap.
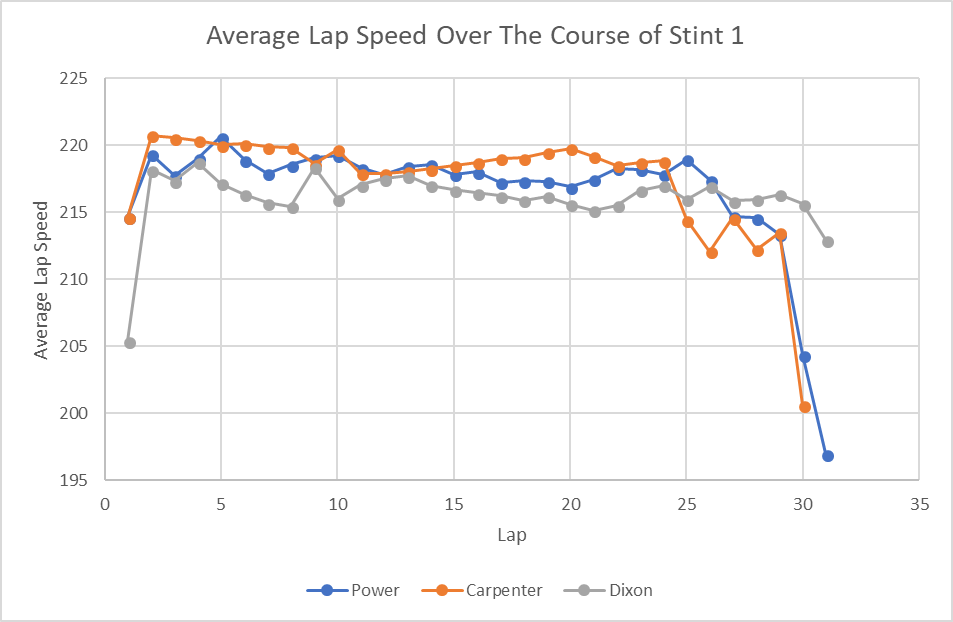
From a first look at the graph, it appears tire wear wasn’t too bad for most of the stint. There were fluctuations from lap to lap as is to be expected as drivers deal with passing other cars or get into the draft, but overall it is a fairly straight line for the first 25 laps of the stint. After that there appears to be a significant dropoff over the course of the next few laps before drivers came in to pit.
Taking a deeper dive into the data yields the same conclusion. Below is a table of the average dropoff in average lap speed compared to the average speed of Lap 2. The second lap was chosen because it was the first full speed lap for the field.

By Lap 20, the tires were on average 2 mph slower than they were on Lap 2. I would personally consider this fairly good tire wear for the 2.5 mile oval, particularly because many people were unsure how this new aero kit would react around Indy both in terms of downforce and tire wear. While there were complaints from the drivers about downforce levels and passing, the field generally seemed pretty content with the tire wear.
After Lap 23 or so tire wear really started to kick in and by Lap 25 the tires were losing nearly 3 mph off of their peak performance. Two laps before Dixon and Power came in and one lap before Carpenter came in the tires were losing 5 mph. Dixon, historically good with tire and fuel use, had the smallest dropoff of this sample of drivers. This could also have been a product of track position too, though. The leaders were catching the tail end of the field at this time and had to deal with overtaking lap cars, so it’s likely some of the disparity in their lap speeds is due to this and not simply just tire management. That is why I chose to look at a group of drivers and not just one.
What we learn from looking at this data is that overall the tires wore pretty well at Indy. They had a minimal dropoff for the first 22 laps of the stint and then a few tenths of a mile an hour per lap after that. The two laps before the end of the stint saw a much larger dropoff than other laps and it signaled to the driver it was time to come in.
Follow The Single Seater on Twitter!
Photo courtesy of Richard Dowdy/IndyCar
by Drew
