What If Power Had Started At St. Pete?

If you haven’t already read about how we’re forecasting the 2016 IndyCar Championship, you can read about it here. Our latest forecast is here.

One of the benefits of having a model is that we can play with it to see how the championship odds would be different if certain events happen/happened. That’s what I’m going to be doing today.

Will Power didn’t race in St. Petersburg because he had concussion-like symptoms, so he scored zero points in round one. What if he had just (carefully) whipped the car around the track once? Coming in and retiring after the first lap would have put him in P22, securing him eight points. Here’s how the championship odds would be different:

Current odds for Power to win: 29.3%
Odds if Power had scored eight points in round one: 32.1
Change: +2.8

What about if the first race hadn’t happened at all? That would put Power 15 points ahead of Pagenaud in the points standings right now. Here’s how that would change the picture:

Current odds for Power to win: 29.3
Odds if first race didn’t happen: 63.0
Change: +33.7

by Drew

Championship Update: Pagenaud’s Lead is Looking Strong With Two to Go

After a crazy Saturday night at Texas that saw the win decided by 0.008 seconds, Pagenaud heads to Watkins Glen in firm control of the championship. His title odds sit at just over 70 percent with two races — both road courses — left to go, according to our model.

Both Power and Pagenaud said after the race that they were playing it safe out there, trying to avoid losing the championship instead of going out and winning it. While that strategy may be fine for the leader, Power lost eight points to his rival and teammate by finishing four places behind him. The play-it-safe tactic will have to be left behind this week by the Aussie.

Power has a 29.3 percent chance of winning the championship, primarily because of the double points on offer out in California. That ensures that the title won’t be decided this weekend.

This leaves the field with a 0.6 percent chance of pulling the ultimate upset.

Oh and for those of you who are looking forward to a championship that will be extremely close: don’t hold your breath. There’s just a 13 percent chance the championship will be decided by less than 10 points.

by Drew

How The IndyCar Championship Model Works

For the past couple days I’ve been working on a model that gives the odds of each driver winning the IndyCar championship. In this article I’ll do my best to explain how it works and what it means for the title race this season.

The Model
The basis of the model is the probability of each driver finishing in each position. Using data from the current season, I found what the odds were that Power would finish in first, second, third, etc. I did that for all drivers with a chance of winning the championship with two races remaining. I chose to only use data from this season as a way of 1) accounting for momentum and 2) not diluting the model with data from a prior season when 14 races have already been run this year, which is a fairly good sample size for IndyCar. In the future I plan to include past season’s data on a weighted scale, valuing the current season more than recent ones while still including them in the model. 
As you might imagine, not every driver finished in every position this season (or even over the past couple seasons). But just because Power hasn’t finished in 13th yet this season, that doesn’t mean he should have a zero percent chance of finishing there in the upcoming races. The way I deal with this is by dividing race finishing places into different groups. Finishing probabilities for first, second, and third are all calculated by themselves right now, meaning a driver’s probability of coming in second place in a race truly is his second place finishing probability. Positions four and five are grouped together, as are positions 6-10 and 11-22. If a driver has a 10 percent chance of finishing in fourth in a race and a five percent chance of finishing in fifth, the model will say he has a 7.5 percent chance of finishing in both of these positions instead. The same process is done for the other groups. Since these position groups offer similar points, the solution is workable. 
Another reason the grouping system is important is because finishing in the top three positions require more skill than other positions. The difference between fourth and fifth is based on a good amount of luck instead of skill. That factor of luck is compounded even more in the 11-22 position range. There are so many factors that go into finishing a race that discerning any skill difference in finishing 13th and 17th is almost impossible. Average drivers can finish in the top ten, but it’s very hard for average drivers to finish in the top three.
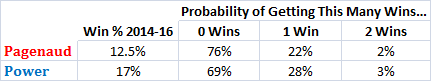
Now that the model knows the probability of the drivers finishing in each position, it can simulate the remaining races on the calendar 10,000 times and see how the championship plays out. Point results for each race are added up in addition to the points drivers already have. There’s also an adjustment and bonus points awarded for getting pole position, leading a lap, and leading the most laps. After that it’s simple math. The model counts up the number of times each driver wins the championship, divides it by the number of simulations run, and spits out a probability of winning the championship.
After each race is completed, the model is updated with the actual points standings, the latest finishing place probabilities, and then runs a new set of simulations with updated championship probabilities. 
Future Updates
There are a few things I plan of adding to the model in the future. First, as I mentioned before, I will be adding in past season’s data, weighted according to how recently the race took place. This will help fine tune the model in regards to the finishing group percentages. I can’t see ever doing away with the finishing groups completely because once you had enough races to have an accurate sample size for each position on the track (thus not needing the finishing group setup anymore), the results being used would be so old it wouldn’t be telling you anything that is predictive of the future.
I also plan to add a track adjustment in the future to account for drivers who are better on certain tracks. If not a new adjustment for each track, there will definitely be a road/street/oval adjustment. 
The Results
The current championship probabilities can be found here. I’ll do article updates before and after races tracking how the championship hopes have changed for different drivers.
by Drew

Power Has a 28% Chance of Winning Watkins Glen or Sonoma

The IndyCar championship is down to just two races: Watkins Glen, where the series hasn’t raced since 2010, and Sonoma. Will Power is trailing Simon Pagenaud by 28 points right now and most people say he’ll need a win to have a shot at the championship. His rival has been very good at finishing races this year, so banking on another DNF from him isn’t a worthy strategy. 
Using a binomial distribution — which gives the chance of a certain number of successes (in our cases wins) occurring in a given number of trials (races) — I calculated the odds of both Pagenaud and Power winning zero, one, or both of the races remaining. Their expected win probability was based off of their winning percentage from 2014 through Texas 2016. Here’s what I found:

Both drivers are more likely than not to go winless over the last two races, which hurts the chaser more than the leader. Power has slightly better than a one in four chance of picking up a win. Securing two wins has less than a five percent chance of occurring for both drivers.

The result of this quick analysis reaffirms the idea that Power really does have to go out and take control of these races if he wants to win the title. Pagenaud will be more focused on finishing the race high up the field but not necessarily winning, opting to try and stay out of trouble instead. He’ll know the odds of Power winning one of the races is pretty low and that he just needs to keep a cool head on the track to take home a nice trophy.

Update — 3:51 p.m., 8/31
One caveat of using a binomial distribution that I failed to mention is that a binomial distribution assumes all trials are independent. That is, the probability of winning one race doesn’t affect the probability of winning a future one. After Watkins Glen, the respective win probabilities for both drivers will change because they will have either won a race or not in the time frame we are looking at. The only part of our analysis that is truly affected by this is the probability of winning two races. If a driver wins the first one, their probability of winning the last race too will go up.

by Drew

The Qualifying Lap That Could Have Been: Belgium 2016

Vettel’s best qualifying lap for the Belgian Grand Prix was 1:07.108. His theoretical best lap time was almost a full tenth faster at 1:07.013.

Wait what? His theoretical best time?

A driver’s theoretical best time takes his best time from each of the three sectors throughout the qualifying session, no matter what lap or round they came in, and adds them together. This new theoretical best (from now on referred to as TB) is the best time the driver could have hoped to achieve if he ran all of his best sector times on the same lap.

Now, this isn’t a perfect indication of what could be done by the driver. For example, perhaps the reason one driver has such a low sector one time (helping his TB) is because he braked for the corner that began sector two way too late and ran off the track. That sector one time he posted will still be included in his TB, but it’s important to note that he could never complete a full lap while posting such a fast sector one time. So his TB time will be slightly above what you could actually expect from him if he were to qualify again at the track.

The Top Ten at Spa

Here’s a look at the data in full from Belgium for the top ten drivers who qualified. The light blue column shows where the driver would have started if the grid was set using TB lap times. I’ve also included a driver “TheoBest” in red whose time is the best sector times of the session not necessarily from the same driver. For this race TheoBest is made up of Rosberg for sectors one and three and Verstappen for sector two.

If a driver’s difference between actual qualifying time and ultimate (TB) qualifying time is zero, that means he ran all three of his best sector times on the same lap.

Click to enlarge

Some Quick Takes on the Results

  • Raikkonen had the most to gain from stringing together his three best sectors on the same lap. He would have shaved two tenths off of his time and jumped from the second row to first on the grid. 
  • Massa had the greatest difference between his actual and TB times with a 0.823 second difference. Even with such a large difference though, he would have only gained two spots and move into eighth place on the grid.
  • Rosberg was 0.264 seconds off of our made up driver, “TheoBest.” The only sector he lost time on “TheoBest” was sector two. 
If you’re interested in getting updates on ultimate qualifying laps for future grand prix let me know in the comments below.
by Drew