How important is qualifying position in IndyCar?

Saturday is always deemed an important day in the racing world. It’s the day qualifying takes place for the following day’s race, and the grid is set according to speed. But does it really matter where you qualify? How much of an impact does it have on the race? And does the type of track matter? 

To figure out if it does indeed matter, I looked up the race winner of every IndyCar race at all tracks the series is heading to this year (2016) and noted their starting position. To start, I only looked at road/street courses because they are harder to pass at than ovals — I’ll be doing the same for ovals later. Making and graphing a histogram for all of the starting positions of race winners produces the following:

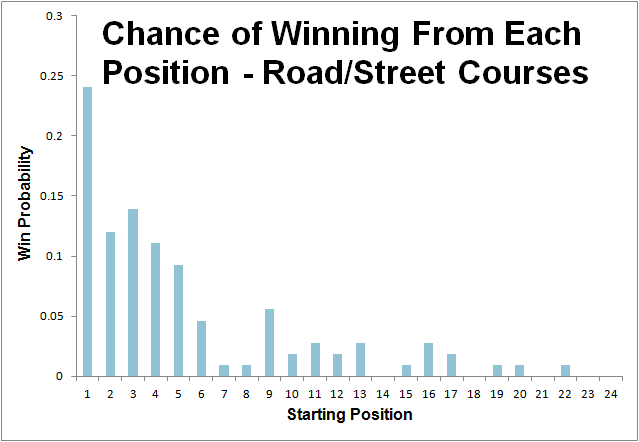
Starting from pole position gets you the race win 24.1 percent of the time compared to 12 and 13.9 percent from second and third places respectively. That means that the difference between starting in second and first is a 12.1 percent chance of winning. The increase from second to third could be purely random (the sample size is relatively small at 108 races), or it could have to do with having the inside line heading into the first turn. It could be beneficial to start right behind the leader on the “good” side of the track instead of next to the leader on the outside.

Fourth and fifth place grid positions are 13.9 and 11.1 percent chances, and the rest of field is below ten percent. No one has won an IndyCar race after starting in 14th, 18th, 21st, 23rd, or 24th — but that’s just random and not anything significant.

Oval Analysis

Doing the same analysis for ovals yields this graph:


Starting on pole position on an oval is slightly less important than on the streets, with a win percentage of 21.7 — a 2.5 point difference. Second and third places have a 15.9 and 13 percent win probability. Both of these are higher than their street counterparts. After that, no place has a win probability greater than six percent. Eight, ninth, and seventeenth places are all just below that at 5.8 percent. 

What We Learned

All in all, it actually looks pretty even between roads and ovals. Adding up the top three places’ win probability for both comes out to right around 50 percent for each. Expanding that to the top five places shows us some disparity though. The probability of a driver winning from one of the top five grid positions is 70.4 percent on the road/street courses. At ovals, that number is only 56.2.

Once you get out of the top five starting positions on an oval track, everybody starts to even out — this leaves the field (drivers starting lower than P5) with a 43.8 percent chance of winning. On streets, the field only has a 29.6 percent chance.

In both cases, starting up front does give you a definite advantage over the rest of the field. Ovals are more forgiving once you get past the top positions as the field evens out pretty well — the average place after P3 (up to P24, so it’s comparative to the road/street courses) has a 2.3 percent chance of winning.

-Drew

Perez Is Actually In A Pretty Good Position With Force India

Sergio Perez said on Saturday that he would be open to leaving Force India for another opportunity if his current team can’t find a way to move up the grid and compete for wins and championships. “That would be fantastic to move up the grid [together]” Perez said, “but if another opportunity comes in the future, it wouldn’t be that bad as well.” If a spot opened up at Mercedes or Ferrari, I think most people would agree that Perez should take it — both are competitive teams with a good history of success and have the money. But the odds of that happening appear to be pretty slim right now. Even so, Perez isn’t in a bad position by any means.

Force India does appear to be climbing as of late, as does Perez himself. Since 2008, Force India has improved on or equaled their prior year’s position in the constructor’s championship all but once. Their first season in Formula One yielded a tenth place finish, and last year they came away with fifth, 51 points shy of Red Bull — the same Red Bull that won the constructor’s championship four years in a row starting in 2010. The team also has the luxury of running Mercedes engines, which powered the dominant performance of Mercedes AMG Petronas the last two seasons. The team had a combined 21 top-ten finishes in 2015 between Nico Hulkenberg and Perez, and finished third in Russia thanks to the latter.

FORCE INDIA TEAM PERFORMANCE

All of the success last season also came after a troubled start, with Force India’s B-Spec car not making its debut until Silverstone. Money problems plagued the team before the season and prevented them from even testing their car in the first two off-season tests. Otmar Szafnauer of Force India commented on the team’s late start to last season, saying “had we been able to [develop the car] at the beginning of the year, who knows where we could have finished?” The team will have a much cleaner start to 2016 and field a car they’re proud of when the green flag waves in Australia. Coupled with momentum from a strong finish to 2015, Force India looks to be in a great position to excel next season.

Sergio Perez’s stock as a driver has also risen the past couple of seasons, with 2015 ending in a ninth place finish in the championship — ahead of his teammate, Hulkenberg. Perez has shown significant improvement since he found his first Formula One ride at Sauber in 2011. Perez cracked the top ten for the first time in average finish (9.2) and was just outside in average start (10.3) last season. He also scored more points than in any prior season (78) and finished all but one race — a break failure in Hungary took him out on lap 53. There’s no denying Perez’s uptick in performance, especially since he joined Force India in 2014.

SERGIO PEREZ PERFORMANCE

Perez will be joined by Hulkenberg once again at Force India in 2016. Both drivers will have multiple years driving for the team under their belt, and besides the rumors of a re-branding to Aston Martin, things appear cool, calm, and collected at Force India from the outside. Next season will be a great test for Perez and his team to keep their momentum going and challenge for the next notch up on both the constructor and driver’s championship ladders.

To do the latter, Perez will have to score an estimated 100.4 points, the average number of points eighth place in the championship scored over the last five seasons. That comes out to 4.8 points per race for a 21 race season like we will see next year. A seventh place finish in every race would easily put Perez over that number — but to do that, he would need to improve his average finish by 1.2 places next year, which doesn’t seem likely without major help from the car. A few good race results like his podium in Russia would bring his necessary average finish down considerably though. How the development of next year’s car goes will play a big role in Perez’s quest to climb up another spot in the championship.

Perez may be looking around for a better offer in the future, but things aren’t so bad right now. Himself and his team are both on an upward path heading into the new year.

-Drew

Quick Take: Decreased Pit-Lane Speed on Ovals


As part of the new rule changes for 2016, IndyCar announced that the pit-lane speed on ovals would be reduced from 60 mph to 50 mph. This is meant to make pit-stops safer for drivers, crew, and officials. Obviously since all drivers are subject to this rule, there isn’t going to be any change in the pit-lane racing. But let’s compare the two speeds to see how much of a difference it really makes in terms of track time lost between seasons.

First off, let’s switch the speeds to meters-per-second. It’s easier to work with. 60 mph comes out to 26.8 m/s and 50 mph is 22.4 m/s. Now let’s say the total length of pit-lane is 200 meters with the pit-box right in the middle (the location of the car in the box is immaterial). It would take a 60 mph car (we’ll call it Car A) 3.7 seconds to get to his box — ignoring braking time. Car B (50 mph) would arrive at his box 4.5 seconds after entering pit-lane, .8 seconds behind Car A. After the pit-stop is done (in 10 seconds), it takes another 3.7 seconds for Car A and 4.5 seconds for Car B to make it off of pit road.

Add the times together and Car A has a 17.4 second pit-lane delta and Car B has a 19 second delta. That’s a pretty sizable gap when it comes to racing. And it’s even more so when it comes to racing the other cars out on track. A car on track traveling at 200 mph (89.4 m/s) will have covered 1,556 meters in the time it takes Car A to complete his pit cycle, and 1,699 meters in the time it takes Car B. That’s almost a 150 meter difference, just shy of the length of the short straightaway at Indianapolis.

Pitting will cost a driver more track position at speedways in 2016 than it did in 2015. Pit-stops will take longer, meaning the timing of them could become even more important next year as teams try to avoid the green flag stop.


by: Drew B., Founder

Rookie Look: Matthew Brabham


Matthew Brabham will compete in rounds five and six, the GP of Indy and Indianapolis 500, next year for PIRTEK Team Murray. The 21 year-old American will get his first call up to the big leagues in 2016 after previously competing in IndyLights and Formula E (for two races). His team is working in conjunction with KV Racing to field their car for the races. Brabham will be just the third 3rd-generation driver to compete in the 500, following in the footsteps of his father and grandfather (a 3-time Formula One World Champion). Here’s a look at what should be expected from him.

Brabham didn’t race a full season in any series this year, competing in three IndyLights races for Andretti Autosport and two Formula E races for the same owner. In the 13 car Lights field, Brabham failed to crack the top five once, finishing 11th twice and seventh once. Not much to write home about. He performed little better in Formula E, finishing 13th and 17th.

Let’s go back a year to 2014, where Brabham completed a full, 14 race season in IndyLights (all races had between 8 and 12 cars in them). Brabham won the first Indianapolis GP race and took fourth in the second, meaning he’ll be familiar with the track when he heads there for his first IndyCar race in May. In the Freedom 100 (the Indianapolis 500 equivalent for IndyLights) he started third and finished runner up to current IndyCar driver Gabby Chaves in the closest finish ever — the margin of victory was .005 seconds. Brabham will get a chance to go head-to-head against Chaves once again this year.

His complete season stats looked like this: 1 win, 4 podiums, average start of 3.9, average finish of 5.2, 4th place in the championship. Overall, not a bad season, but it’s also IndyLights. He’s not competing against the best drivers in the world, and that explains why he’s only getting a ride for two races in 2016. He’s a good IndyLights driver, not a great one.

His third-generation story no doubt played the biggest role in getting him the ride. He couldn’t secure a full-ride anywhere last season and probably wouldn’t have been able to secure his two race deal this year without it. Jack Harvey and Ed Jones would have both been better choices for a team looking to truly compete for a good race result. I’m not trying to disregard him; being a third-generation Indy 500 driver is amazing and I’m sure he’ll be able to beat some guys when he gets in the car — if the Chevrolet advantage still exists. But based on the numbers, I just don’t see Brabham being much of a competitor in IndyCar next season.


Photo courtesy of IndyCar

by: Drew B., Founder

Top Numbers From The 2015 Season

The new year is right around the corner (just 78 days until St. Petersburg!), and there’s a lot to look forward to in regards to next season. An earlier start date and later end date to the season, the 100th running of the Indianapolis 500, and the first Grand Prix of Boston, to name a few. It’s also a good time to reflect on this year as well. And being Single Seater, we’re going to take a look at the top statistics and numbers from the season.

0: What better number to start with than the points separating first and second place in the championship. Scott Dixon and Juan Pablo Montoya were tied in the points standings after a thrilling season finale in Sonoma. Montoya placed 6th in the race and Dixon won it (giving him the extra win to beat Montoya in the tiebreaker). Let’s hope next year’s championship is just as competitive as this one was.

80: The number of lead changes at Fontana this year. The heavily criticized event by both drivers and fans featured the most lead changes of any IndyCar or CART race there in history. Graham Rahal ended up winning the three hour epic.

5.8: This next number comes courtesy of our own statistic, R+/-. Ryan Briscoe held the highest R+/- score of any driver this season. He qualified pretty poorly in the eight races he started but was a contender for a handful of race wins. In fact, he finished higher in the championship than four drivers who completed more races than him, too — Stefano Colletti raced in 16 races to Briscoe’s 8 and was still two points shy of him in the points standings.

345: Josef Newgarden led 15.5 percent of the 2,232 laps run this year, the most of any driver. The bulk of these laps came at Milwaukee and Iowa where he led over 100 laps each.  He was only able to muster seventh place in the points though. Three DNFs and two more 20+ place finishes kept Newgarden from competing for the championship later into the season. Newgarden prevailed as one of the most promising young drivers this season and will surely shine again in 2016.

$3,526,100: The winnings Montoya will take home, according to Racing Reference, simply from race performances alone. This is the most of any driver, largely due to Montoya’s Indianapolis 500 win which netted him $2.5 million. Must be nice.

Here’s to a great 2015 season and an even better 2016!

Photo courtesy of IndyCar.

by: Drew B., Founder