
In my opinion, there isn’t currently a good way to evaluate team strategy in IndyCar based off of the traditional statistics of starting and finishing position. If a car improves throughout a race, was it because of good strategy, great passes, or just being fast? It’s not particularly easy to tell and even if you watch the race, there’s too many cars and different things going on to get a good measure of what happened by the eye test.
To start working on this problem, I am introducing something called Green Flag (GF) Retention and Plus/Minus, inspired by David Smith’s work at Motorsports Analytics. With these statistics, I attempt to begin to quantify how much value a race strategist adds or subtracts from a team, with the idea being that a better strategist will be able to use green flag pit cycles to their advantage and pick up places by short/long pitting at the right time to gain track position, be on better tires than other cars, or simply have quick pitstops. Before I get in to the details of how these stats are calculated, some definitions:
- Green Flag Pitstop Retention – the percentage of time a driver holds or gains positions during a green flag pit cycle.
- Green Flag Pitstop +/- – the total number of places a driver has gained or lost during green flag pit cycles throughout the season.
- Green Flag Pit Cycle – a GF pit cycle is a pitstop cycle that is measured from when the first car pits to when the last car pits out in a given cycle. I only count these stats for pit cycles that are “obvious”, meaning when there is one overarching strategy being used by almost every team and the pit cycle is less than 15 laps. If 22 drivers are going for a three-stop race and all pit around the same laps and two other drivers are going for a four-stop race, I will only count the stats for that race for the 22 drivers on a similar strategy. There is no good way to compare vastly different strategies without making subjective assumptions about the relative position of cars throughout the race. If I compared the different pitstop strategies only at the end of the race to see how they compared, I would be dragging a driver’s whole race performance into the comparison, which dilutes the role strategy played greatly and makes the statistic less of a reliable indicator. As such, not every driver in the database will have the same number of GF pit cycles, but they can still be compared by looking at the +/- per pitstop stat. This would also mean that teams that always run an alternative strategy will not get counted many times in this stat, but in my experience there is usually one overarching strategy for a given race and no team I’ve looked at is always the one trying out an alternative strategy.
To calculate GF Pitstop Retention and Plus/Minus I measure a driver’s running position when the first car comes into the pits and their position when the last car of the cycle exits the pits. If a driver holds or gains position, they are counted as retaining their position for that cycle. The number of places the driver gained or lost is added into the running total of Plus/Minus for the year.
This statistic is not perfect. While many times passes that happen in these cycles are due to strategy and being quick on tires when others are not through short/long pitting or quickness of out/in laps, there might be times when a pass is made on track that really didn’t have to do with strategy but rather two cars who overtake each other before the cycle is over but didn’t benefit from strategy. These overtakes will still be counted in +/- even though maybe it isn’t the strategy specifically that helped them overtake. The statistics are not without fault like any stat, but I feel they are a great start to quantifying and assessing race strategy with the current information available and can provide valuable insight into who the best race strategists are in IndyCar.
The best strategists and teams will call their drivers into the pits at the right time, have quick and error free pitstops, and ultimately gain positions or at the very least retain their position because of these decisions. Cars that always run at the front will obviously have less positional gains as there are less spots to move up, but the best strategists for these teams should still be retaining their position at the same rate as others.
To get an idea of what I consider an acceptable green flag pit cycle, consider this lap chart from COTA 2019:
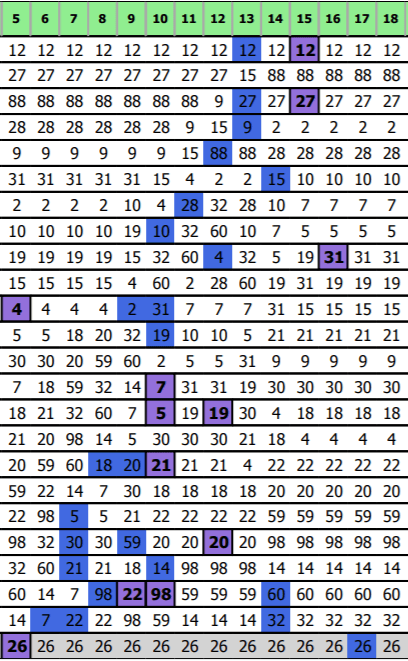
Between laps 5 and 18, every car came into the pits as indicated by the blue squares. The starting position measurement would be on lap 5 and the final position measurement would take place on lap 18. The cycles must be green flag stops or else they will not be counted as caution-affected pitstops will usually catch some drivers out and there is less of a strategy decision as cautions make pit decisions easier. Getting caught out because of an unlucky caution is bad luck, not bad strategy.
Green flag pit cycle stats will be updated on this page throughout the season along with all of the other driver and team statistics.
