
Anyone who has watched a bit of IndyCar racing on TV has probably heard an announcer say something to this effect after a caution period at one time or another: “You know what they say, cautions breed cautions.” It’s unclear who “they” are in this sentence, but we can take it to be the conventional wisdom in racing. The announcers are saying that after a caution flag has been thrown, it’s more likely there will be another caution during the ensuing restart from the caution period. Some explanations for this are that the cars are all bunched up together, some cars will have come to pit while others didn’t, and it’s a prime overtaking opportunity. c
But is it true? Do cautions really breed cautions?
To answer this question, I looked at data from the 2010-2020 IndyCar seasons which amounted to 170 races, 16,771 valid green flag laps, and 606 valid caution periods. The metric I chose to evaluate this question was the probability of seeing a caution within 5 laps of either 1) a randomly selected green flag lap and 2) the end of a caution period. Green flag laps that were within 5 laps of the end of a caution period were not counted as a valid green flag lap because they were effected by the caution period. These laps are tested for cautions to get the probability of seeing a caution within 5 laps of the end of another caution. The theory is that if cautions really do breed cautions, then the probability of seeing another caution flag within 5 laps of the end of a caution period will be higher than the probability of seeing a caution flag within 5 laps of any randomly selected green flag lap.
So, what were the results?
First I looked at these metrics by different track types. The table below shows the results of this analysis. For all tracks, the probability of a caution coming out within five laps of a randomly selected green flag lap was 10.3%. This is compared to a 26.9% chance of seeing a caution within five laps of the end of a caution period. The difference between the probability of seeing a caution withing five laps of a green flag lap vs. the end of a caution period grew larger from ovals to road courses to street courses. On street courses, the probability of seeing a caution within five laps of the end of a caution period was a whopping 37%! Street courses present the most danger on restarts most likely due to their tight corners and little room for error. Street courses have the highest probability of a caution within five laps of any green flag lap, so it only makes sense that bunching up the field and presenting an overtaking opportunity makes cautions that much more likely.

All of the differences for these types of tracks were statistically significant. I had not expected to find such drastic differences between caution probabilities when I first started this analysis, but the “cautions breed cautions” saying has data backing it up. This information is especially important to teams who are planning race strategy both before the race and during. For one, knowing the probability of a caution within five laps can help strategists decide when to pit and help them weigh the risk-reward decision of staying out. The undercut and overcut strategies can be ruined by an ill-timed caution – should you stay out and try an overcut? Well, among other things, it partly depends on how likely you are to see a caution within the next couple of laps. You don’t want to be attempting an overcut when a caution comes out, slowing you down and allowing the drivers who already pit a chance to catch up before you can get in the pits.
Another example that comes to mind is when drivers are near the front of the field and trying to stretch fuel until the end of the race. Caution periods significantly reduce the amount of fuel you burn as you’re going around the track. Should you pit for a splash of fuel when leading and drop down the field or hope a caution comes out that will take you until the end? Well, among other things, the probability of a caution happening within the next couple of laps is going to be very relevant information for you to have when making that decision. By calculating the probability of a caution occurring under different conditions and comparing that to where you would be likely to rejoin if you pit, you could find the strategy that offers the highest expected points payoff for your driver.
I also broke down this analysis by individual tracks and those results are presented in the table below. Keep in mind the column that says whether or not the difference is statistically significant. A lot of the tracks on this list have a small sample size of cautions that prevent us from making too many strong conclusions about that specific track. Other tracks, like Indianapolis and St. Petersburg, for example, have plenty of cautions and green flag laps run for us to make conclusions from.
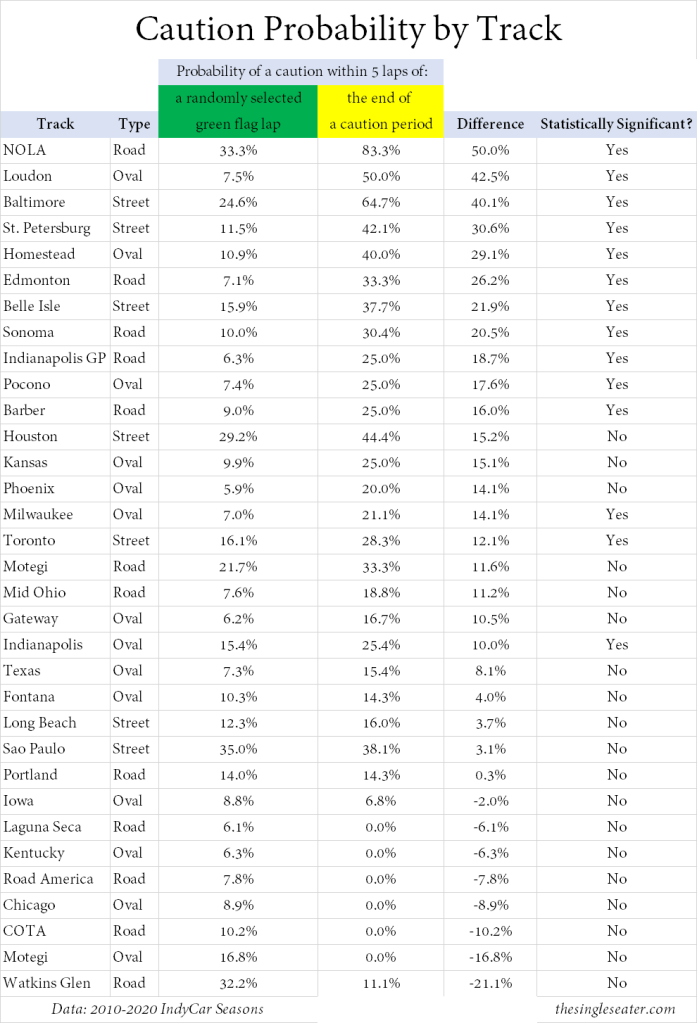
You’ll notice that a few tracks actually have a lower probability of another caution after a caution period than at a randomly selected green flag lap. However, none of these differences are statistically significant so I wouldn’t say that the trend is necessarily reversed at those tracks, just that we need more data. NOLA Motorsports Park has the largest difference in probability with an 83% chance of a caution within 5 laps of the end of a caution period. IndyCar only raced there once and it was an extremely wet race with 6 cautions, so I would not expect such a large difference in probability if IndyCar goes back and races there in the dry. At St. Petersburg, the caution probability increases 30.6% when restarting after a caution compared to a regular green flag lap. At Indianapolis, the caution probability increases 10%.
There is a lot of evidence that cautions do breed cautions. The theories of bunched up cars, aggressive overtaking opportunities, and different pit strategies all likely contribute to the increase that we see across ovals, road tracks, and street tracks when comparing caution probabilities after a caution period and during a regular green flag lap.
Cautions are such an important part of race strategy that oftentimes get talked about as if they are completely random and something that causes drivers to get lucky or unlucky in a race. What this analysis has shown, however, is that cautions are not really random. For tracks with enough history, we can get fairly good estimates (small confidence intervals) of how likely cautions are to occur under different conditions. And this is just the tip of the iceberg. For tracks with years of races, we can answer questions such as “how likely is there to be a caution within 5 laps at Indianapolis under green flag conditions if we’re between laps 170 and 190?” The answer? A 21% chance, which is higher than the full race green flag average of a 15.4% chance.
I believe teams that dedicate the time to analyze the caution history and statistics at upcoming races can outperform their opponents and make consistent, high value decisions when it comes to race strategy and pit strategy. Cautions are just one aspect of pit strategy and race strategy, but they are an extremely important one. Getting it right can help teams get that much closer to winning races and championships.
