Graph of the Day: Age of the IndyCar Champion Over Time

Graph of the Day is a short piece where I post an interesting graph for chart I came across while doing research. Today’s graph looks out how the age of the IndyCar champion has changed over the years. 
Before Newgarden’s title at the age of 26, it appeared the age of the champion was rising ever so slightly on average. Newgarden was the fifth youngest champion since the year 2000. 
It’ll be interesting to see how the younger drivers in the series (Newgarden, Rahal, Rossi) change this trend over time. As the veteran drivers start to retire, I’d expect the average age of the series champ to tick down a little.
by Drew

A Better Measure of Season Competitiveness in IndyCar

In the last article I wrote, I talked about a way to measure the competitiveness of a given IndyCar season. If you haven’t read that article, I would recommend doing so before continuing with this one. That measure was a fairly good first attempt at measuring competitiveness: it gave a good idea of the spread of the field and how dominant the champion was. Kyle Brown, a fellow IndyCar blogger who focuses on the statistics and data of the sport, left a comment on that post suggesting a different approach to measuring competitiveness that built off of what I started with.

Kyle’s suggestion was to sum all of the competitiveness ratios (now referred to as CR) for a given set of the field (we looked at sums of the top-10, top-5, and top-3 drivers specifically). Then, we averaged the ratios for all drivers for each of the sets we looked at — for example, for the top-3 set, we summed second place’s CR and third place’s CR and averaged them. This leaves us with Average Competitiveness Ratio or ACR. As a reminder, an individual place’s CR is given by:

CR = (Champion’s Points – X Place’s Points)/Total Possible Points for a Driver
The advantage of this system over my original is that it takes into account how close each driver was to the champion as opposed to just the X place driver. For example, consider the following two seasons. In hypothetical season A, the top-9 drivers were all separated by one point each and the tenth driver was 200 points back from the champion. In hypothetical season B, the top-9 drivers were all separated by 20 points and and tenth driver was 200 points back from the champion. Under my original method, these seasons would both have the same competitiveness ratio for the top-10 of the field. Under the new system, season A would be considered more competitive (as it should be, because there are more drivers in the championship battle and close to each other) because it’s ACR would be less than season B’s. My original method is a good measure of thecompetitiveness in terms of the spread of the field, but ACR is a better measure of how competitive all of the drivers were in terms of the championship battle. 
Once again, this process gives us a ratio for each season from 0 to 1. The former would be a perfectly competitive season (all drivers score the same number of points) and the latter would be a perfectly non-competitive season (there is one driver winning every possible point in every race and the other drivers aren’t even competing). 
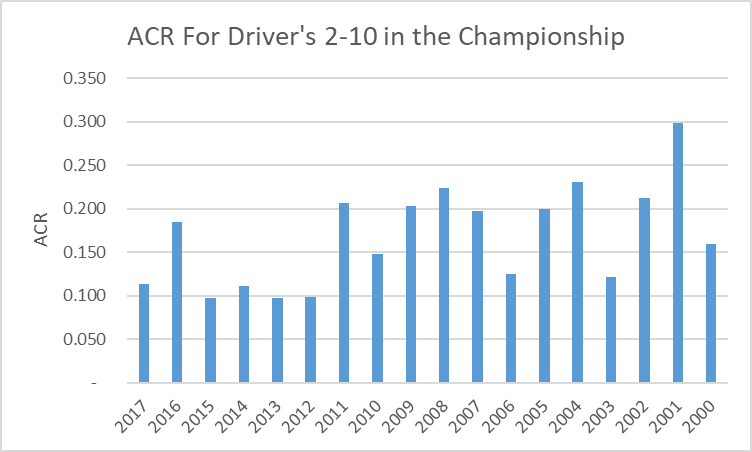
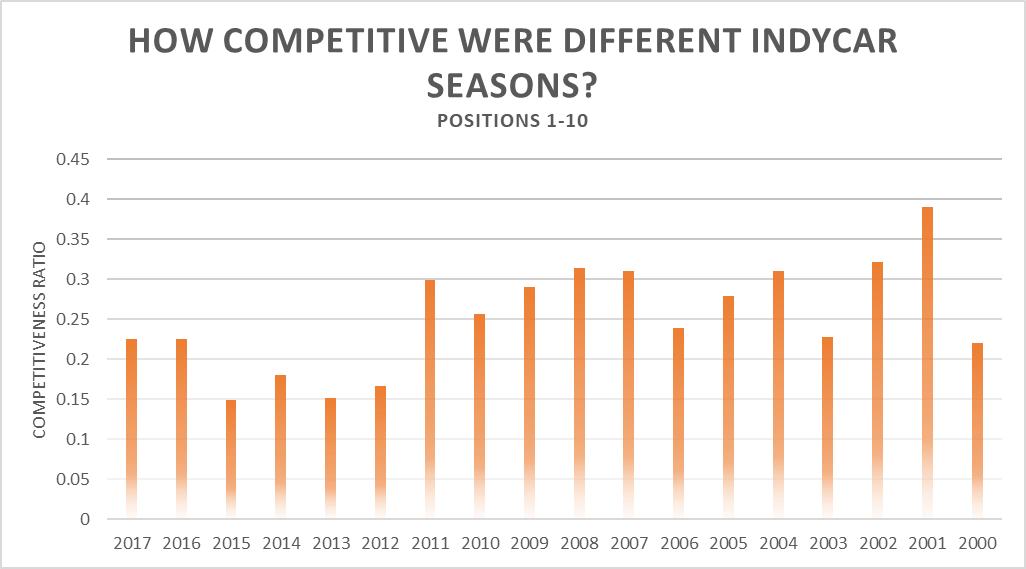
Now that we’ve got the description out of the way, we can get into the results. First, let’s look at the ACR for the top-10 drivers in the seasons 2000-17. 
The 2015 and 2013 seasons both had an ACR of 0.097, making them the most competitive seasons in terms of top-10 competitiveness in our data set. For comparison, 2015 — when Juan Pablo Montoya and Scott Dixon ended up tied in the points after Sonoma — was the most competitive season by my original method. 2001 was the least competitive year as Sam Hornish Jr. won the championship 100 points clear of the field. We see the same drop off at the 2012 season that we saw the last time around, and once again, I think this could be because of the adoption of the Dallara DW-12 chassis. It seems to have made the field more competitive on the whole (or at least the top half of the field).
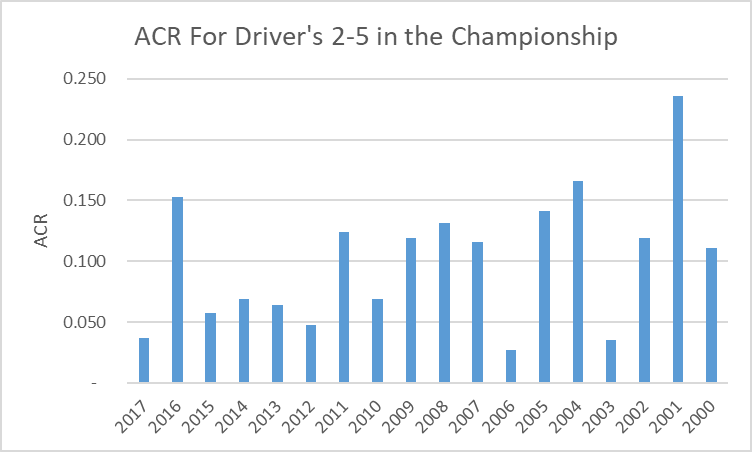
We get the following graph for the top-5 spots in the championship.
The results show us that 2006 had the most competitive top-5 championship. This season the top four places in the championship were separated by just 15 points. Hornish Jr. and Dan Wheldon were tied after the last race and the former won on a tiebreaker. Six different drivers took home race wins and nine different drivers finished on the podium. 
And finally, we have the graph for the top-3. 
2006 was the most competitive season for the top-3 places in the championship, for the same reasons mentioned above. 2001 was the least competitive season for the top-3, largely in part because the champion was 100 points clear of the runner up. And in 2016, Simon Pagenaud won by 127 points, making it the 2nd least competitive season in our time frame with an ACR of 0.14.
Using ACR as opposed to CR for a given place provides a more accurate measure for the competitiveness of a season. It takes into account all places within the specified range and shows how competitive the championship battle really was, which is, at the end of the day, what we all really care about. Exciting championship battles are a sign of an exciting season. I would say using ACR for the top-5 or top-10 drivers is my preferred range when looking at how competitive a season is, as that’s where most of the action on track takes place each race. I’d prefer a season with a lower top-5 or top-10 ACR over one with just a super low top-3 ACR, because that means many drivers are in the hunt, even if it means the gap to second or third isn’t incredibly low (<10 points). People could have different opinions on which method they prefer to look at of course.
Thanks again to Kyle for the great suggestion and help in compiling the data for this project. 
by Drew

Competitiveness in IndyCar

This year’s IndyCar championship came right down to the wire. There were multiple drivers in the hunt heading into Sonoma and Josef Newgarden ended up winning the title by just 13 points. Helio Castroneves, who finished fourth in the championship, was less than 50 points behind Newgarden when the checkered flag flew. This was a highly contested championship, and it got me thinking about competitiveness within an IndyCar season. There are definitely seasons where there is a dominant driver and ones where multiple drivers are battling it out all season and everyone is close. 
To answer this question of competitiveness, I first had to decide how to measure it. I wanted to look at how competitive the top half of the field was in a given year. I chose the top half to eliminate the problem that some seasons had many lower-level drivers with a lot of DNFs, and account for the fact that different seasons ran with different numbers of drivers. This made the process easier and more valid in my opinion. In the future I might look at competitiveness across the entire field if I come up with a good way to deal with the differing number of drivers and the DNF problem. Looking at the top ten competitiveness gives us a good idea of how hotly contested the championship is and how the races are likely to turn out — plus, most of the important action throughout races happens in the top ten. Less competitive seasons will see repeat winners and more straightforward races for the most part. Since realistically the entire field does not have a shot at winning the title, looking at the top ten is sufficient for our discussion. 
I used a measure similar to the one The Stats Zone used to measure competitiveness across soccer leagues in Europe to measure competitiveness in IndyCar. 
I took the total number of points the champion of that season scored and subtracted from it the number of points the 10th place driver in the championship scored. I took this number and divided it by the total possible points a driver could have scored in that season to account for the different points systems and number of races across seasons. This gives us a ratio from 0 to 1, where 0 would mean a perfectly competitive season (all drivers score the same number of points) and 1 would mean a perfectly non-competitive season (there is one driver winning every point in every race and other drivers aren’t competing). Obviously both of these scenarios are basically impossible, but they represent the extremes and what we mean by perfectly competitive and perfectly non-competitive. 
Here is a chart of all of the competitiveness ratios from 2000-17:

By competitiveness ratio, 2015 was the most competitive IndyCar season. In this season, Scott Dixon and Juan Pablo Montoya ended up tied for the points title after Sonoma, and the former won it on the tiebreaker. Three drivers were within 100 points of Dixon and it was a hard fought championship until the end. The ’13 and ’12 seasons fall in spots two and three in competitiveness. These years saw four and five drivers respectively finish within 100 points of the champion, and ’12 was won by just three points by Ryan Hunter-Reay. The least competitive IndyCar season was 2001 when Sam Hornish Jr. won the championship by over 100 points, finishing on the podium ten times in the 13 race season. 2002 was also an interesting year: while Helio Castoneves was only 20 points behind Hornish Jr., who won the championship again, the rest of the top ten dropped off quickly after that, giving the season a competitiveness ratio of 0.32.
Looking at competitiveness ratio by season, we can see an interesting trend. Right around 2012 there was a drop off and the series has been more competitive since. This could be because of the introduction of the Dallara IR-12 chassis at the start of the 2012 season. The new chassis might be have leveled out the competition more and be the reason for the drop off we see. Aero kits were introduced in 2015, but there wasn’t much of a change from the two years prior in terms of competitiveness. It’ll be interesting to see how the universal aero kits being introduced for the 2018 season will change the competitiveness of the series.
Competitiveness in IndyCar is an interesting topic and I’d definitely like to explore it more in the future. Finding a way to incorporate full field competitiveness is a goal of mine and I’ll be posting more about the subject in the future.

Read part two of this series on competitiveness in IndyCar here.

by Drew

Updated 11/17: Fixed an error in allocating bonus points for certain seasons. The least competitive season is now 2001 instead of 2008. The chart and article have been updated with the small change.

Power Cleared For Sonoma

Most people figured this would be the case, especially with two weeks before the final race, but now it’s official. Will Power was cleared after having concussion-like symptoms and will race in Sonoma.

The important parts about all of this are (a) Power is okay and (b) he can participate in the test on Thursday at Sonoma. That’ll not only help us get an early indication of how this final race is likely to play out, but it’ll also give Power a chance to find that extra speed he’ll need to take the title fight to Pagenaud.

by Drew

Power Needs Pagenaud To Pull a Montoya

There’s just a 16 percent chance that the points lead (and championship) will shift to Power in the last race of the year. Pagenaud has looked strong all season leading wire to wire and sits with a 43 point lead heading to Sonoma. That’s the fourth biggest lead a driver has held heading into the last race in the past eleven years. Of the drivers who had a larger points lead, only one ended up losing the title: Montoya in 2015.

I went back and looked at the results of the past eleven championships, noting who was leading the points heading into the final race and who ended up winning. The seasons highlighted in yellow are ones in which the driver who led the points before the last race didn’t win the title. 
In all seven “yellow” seasons bar 2015, the gap before the last race was under 20 points. Montoya’s loss in 2015 was a fluke, not the norm — at least not yet. Double points in the final race is still a fairly new concept and it’s yet to be seen if it will change this theme. That’s bad news for Power who needs to come back from a deficit closely resembling Dixon’s last year. He’ll be looking for Pagenaud to either (i) get into some sort of crash and drop back or (ii) have a DNF. While both of these are seemingly long-shot scenarios to happen, they’re more likely than Pagenaud simply having a bad race on his own.
A lead of 20 or more points has been safe four times out of five. Even when you look at the 2015 incident, Montoya didn’t lose the championship outright. It took a tiebreaker to declare Dixon the winner. If the championship ended in a tie this year, here’s what would happen:
  • If Power or Pagenaud won the race, that driver would have the most first place finishes and win the championship.
  • If neither driver wins the race and Power doesn’t come in second, Pagenaud wins.
  • If neither driver wins the race and Pagenaud comes in second, he wins.
  • If neither driver wins the race and Power comes in second, Pagenaud and Power will be tied in second place finishes, and Power will win based on third place finishes, so long as Pagenaud doesn’t come in third.
  • If one of those scenarios doesn’t happen, well, we’ll figure that out when the time comes.
Luckily (unluckily?) we probably won’t have to deal with a tie in the championship. There’s just a 0.56% chance of the championship being tied after Sonoma.

by Drew