This is a really fun article for me to write because one of my first “big goals” when I started writing about IndyCar statistics was to apply the Elo rating system to IndyCar drivers. Elo ratings were developed by Arpad Elo to rank chess players, but they have since been used to rank sports from soccer to football to basketball and more. Elo ratings have a couple of great qualities that make them a good choice to rank and compare IndyCar drivers. The first part of this article will detail how the ratings are calculated, but feel free to skip past that for the results or come back to it later!
How IndyCar Elo Ratings Work
Elo ratings are updated after each race using the following formula:
NewRating = OldRating + K(WonMatchup – ExpectedWinMatchup)
Let’s break that down.
The OldRating is the driver’s Elo rating before the race. K is the k-factor, which tells the ratings how much to update after each race. It essentially is a measure of how important each matchup is to the system and differs in every sport. In baseball, where there are a lot of games, the k is lower than in football, for example. For IndyCar, I found k=2.5 to be the most predictive. WonMatchup is a 1 or 0 depending on if the driver beat their opponent in given matchup. I treat each race as a series of matchups between every single driver. For example, if a race had three drivers in it, Newgarden, Rossi, and Dixon, I treat it as three separate races of Newgarden vs. Rossi, Newgarden vs. Dixon, and Rossi vs. Dixon. This allows us to use the original Elo rating formula which initially could only be used for two player games. ExpectedWinMatchup is the probability that the driver would have beaten their opponent before the race given their respective Elo ratings. In essence this makes beating better opponents worth more points, and good drivers beating poor drivers aren’t rewarded as much as poor drivers are when they beat good drivers.
The ExpectedWinMatchup value comes from the differences between the two drivers’ ratings. A 0 point difference in Elo ratings means the drivers have a 50/50 shot of beating each other, while a 100 point difference in Elo ratings means the better driver has a 64% chance of beating the other. The value for ExpectedWinMatchup is calculated from this formula:
DriverA ExpectedWinMatchup = 1/(1+10^(EloRatingB-EloRatingA)/400)
When I calculate my Elo ratings for The Single Seater, I add one more feature to the Elo ratings. A driver’s ExpectedWinMatchup is impacted by their starting position for each race, too. Driver A with an Elo rating 100 points better than Driver B is expected to beat Driver B 64% of the time, but that number is higher if Driver A starts in front of Driver B and it’s lower if Driver A starts behind Driver B. Each starting position on the grid is worth a certain amount of Elo points. I found that including starting position as part of ExpectedWinMatchup improved my predictions quite a bit.
So, why should we look at Elo ratings in the first place?
For one, they are zero sum. Every gain in points by one driver is an equal loss of points for another driver. This is great because it allows us to compare drivers to an average of 1500 and track their performances over time. The average of all drivers’ Elo ratings will always be 1500. Second, all it cares about is beating drivers, and beating better drivers is worth more points. There are no double points awarded or anything like that. They also allow us to track driver performances over time, predict head-to-head matchup results, generate race win probabilities, and simulate entire seasons to get championship predictions.
When testing how predictive the model was for determining the winner of head-to-head matchups, Elo ratings did a significantly better job than relying on starting position alone.
The Results
Using data from the 2008-2019 IndyCar seasons, I calculated Elo ratings for every driver who raced in one of these 200+ races. Before the first race of 2008, all drivers were initiated with 1500 points. This doesn’t mean I think all drivers were of equal skill going into 2008, but rather that the Elo rating system has to start somewhere and 2008 seemed like a good pick since it’s when the Indy Racing League and Champ Car merged.
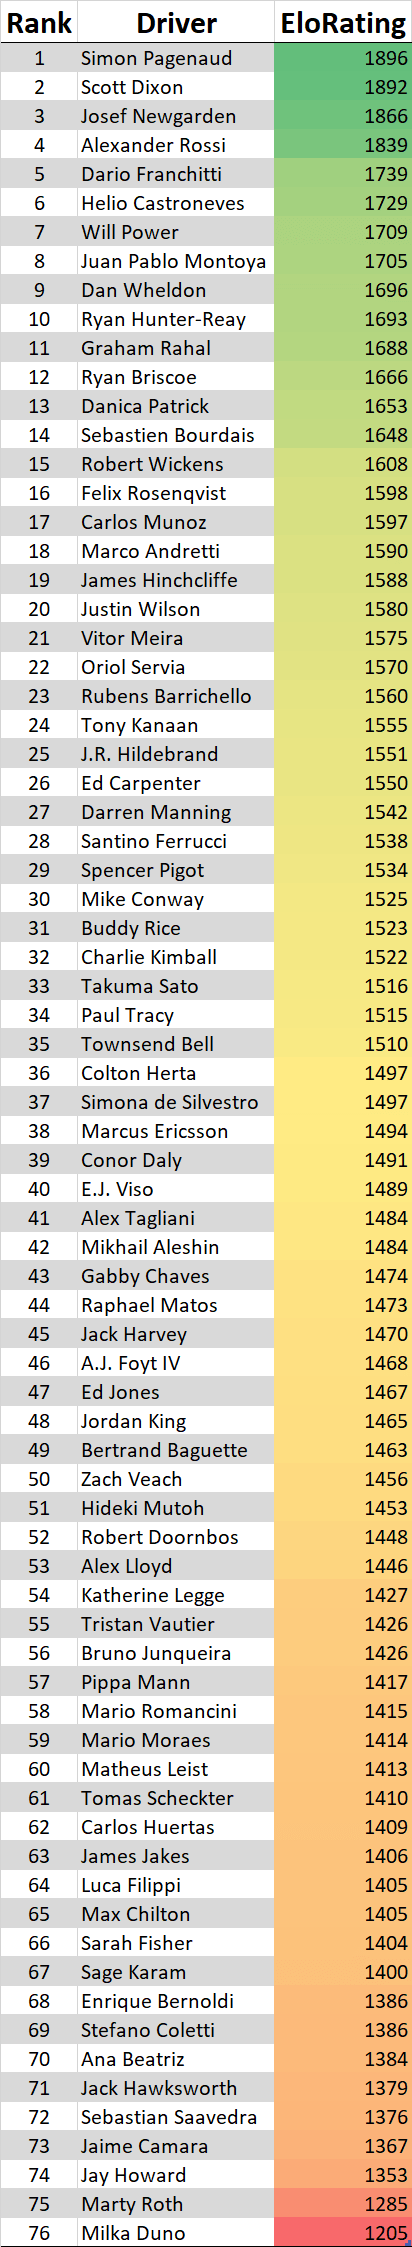
First, here’s a look at the Elo ratings as of the end of the 2019 season. Since the 2020 season hasn’t started yet as of writing, these are also the Elo ratings as of today. Only drivers with more than 10 race starts are shown. Pagenaud has the highest current Elo rating at 1896 leading Dixon by just four points. Newgarden and Rossi are also in what I’ll call the top group and then there’s drop off to Franchitti and Castroneves. One thing I just want to reiterate here is that the ratings know nothing of what happened before the 2008 season. So, drivers who might have had their best years before 2008 won’t be reflected as well in these ratings. It also takes some time for ratings to build up (or down), so drivers like Colton Herta who have only 18 races under their belt are probably still waiting for their rankings to fully reflect their skill. That said, Herta’s rating of 1497 seems to accurately reflect his up and down season of two race wins and seven finishes outside of the top-15. Milka Duno gets the unwanted honor of the lowest Elo rating at 1205.
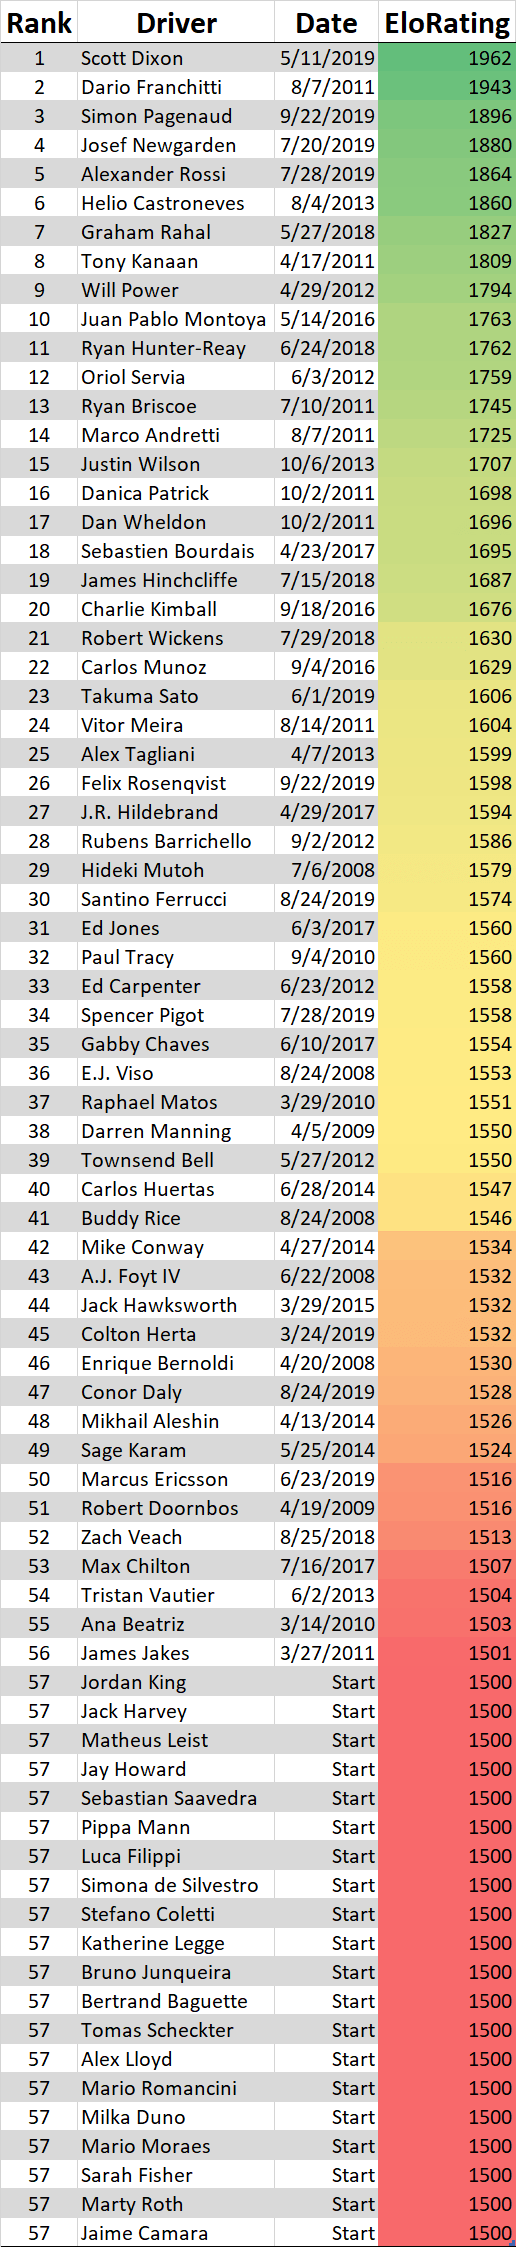
The current Elo ratings are great for comparing drivers who are currently in the series, but they might not reflect the true skill of some people whose careers have ended and had their peaks before they retired or left the series. So, now let’s look at the maximum Elo ratings for these drivers. Essentially, what was the highest Elo rating a driver ever achieved, and on what race date did they achieve it?
Scott Dixon had the highest Elo rating ever seen at 1962 achieved after coming second at the Indianapolis G.P. in 2019. Dario Franchitti follows closely behind with a peak of 1943 after coming second at Mid Ohio in 2011. Dixon won that race.
I’m not at all surprised to see these two at the top of the rankings, and they separate themselves by 47 points to the next set of top drivers. Pagenaud, Newgarden, Rossi, and Castroneves all have peak Elo ratings of 1860 and above. One interesting driver to me is Will Power. He has a max Elo rating of 1794 which is below a lot of the guys he is regularly competing with at Penske. I definitely want to look into this more, but my first thought is that it could reflect his ability to be consistent race to race, but not always winding up on top. He builds his championship fights through consistency and running at the top, not necessarily wins. In his 2014 title-winning season, he was one of only two drivers to finish every single race running. He also only won three races that season. The championship winner in 2019 won four races, the 2017 winner won four and the 2016 winner won five.
If a driver has a max Elo rating of 1500, that means they went below their initial value and never came back above it. Not good.
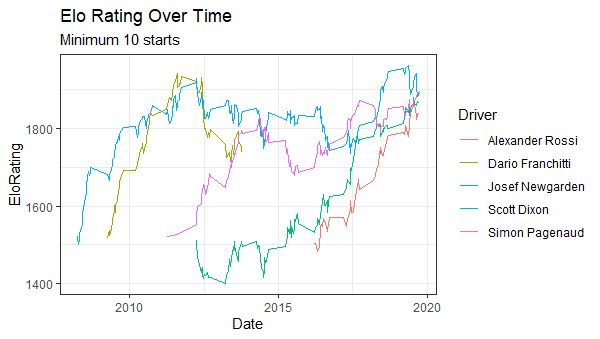
We can also look at this data in a graph to see how ratings change over time. It would be too many lines to plot every driver, so for now I’ll select the top five drivers from our tables above. The first graph are the drivers’ Elo ratings over time. Given that Dixon, Franchitti, and Pagnaud were already racing at a high level when they entered the IndyCar series (Dixon in IRL, Franchitti in IRL and NASCAR in 2008, Pagenaud in American Le Mans until 2011/12), it makes sense that their Elo ratings shot up pretty quickly once they started getting tracked. They were already well established and quick– they just started earning Elo points for that.
Newgarden on the other hand had only Indy Lights experience and he started his IndyCar season treading into below average territory. 1500 is average, and Newgarden didn’t pull himself permanently out of below average territory until the 2015 season. Rossi, coming from Formula One experience, didn’t have that same difficultly when he first entered the series. Granted, Rossi was older when he started racing Indy cars.
The final graph I want to show is the same as above, but with the x-axis changed to “Race number in career.” This allows us to compare drivers at different stages in their careers more fairly. Plotting by race number in career comes with the same warning as above. It’s race number in career starting at 2008, so Dixon’s first IndyCar race wasn’t truly his “first” race in essentially the IndyCar series. Newgarden’s first race, though, is his first race in IndyCar.
Here you can more clearly see the different starts Newgarden and Rossi got in their IndyCar careers. Rossi didn’t really miss a beat while Newgarden took longer to get going. Rossi is outperforming Newgarden relative to where Newgarden was at the same point in his career. Among drivers who entered the IndyCar season after 2008, this is my preferred method for comparing drivers’ careers.

Elo ratings can be used for so many interesting comparisons that all of the cool stuff can’t be put into one reasonably sized article. I have already begun work on a championship simulation that uses Elo ratings that I feel is an improvement on the one I used last year. If you have specific driver comparisons you want showcased or graphed, let me know on Twitter and I can send them out on there. If you have any questions on Elo ratings, let me know in the comments below or check out the Wikipedia page which does a good job of explaining most things!
Header photo: Chris Graythen (Getty Images)

2 thoughts on “Ranking IndyCar Drivers With Elo Ratings”